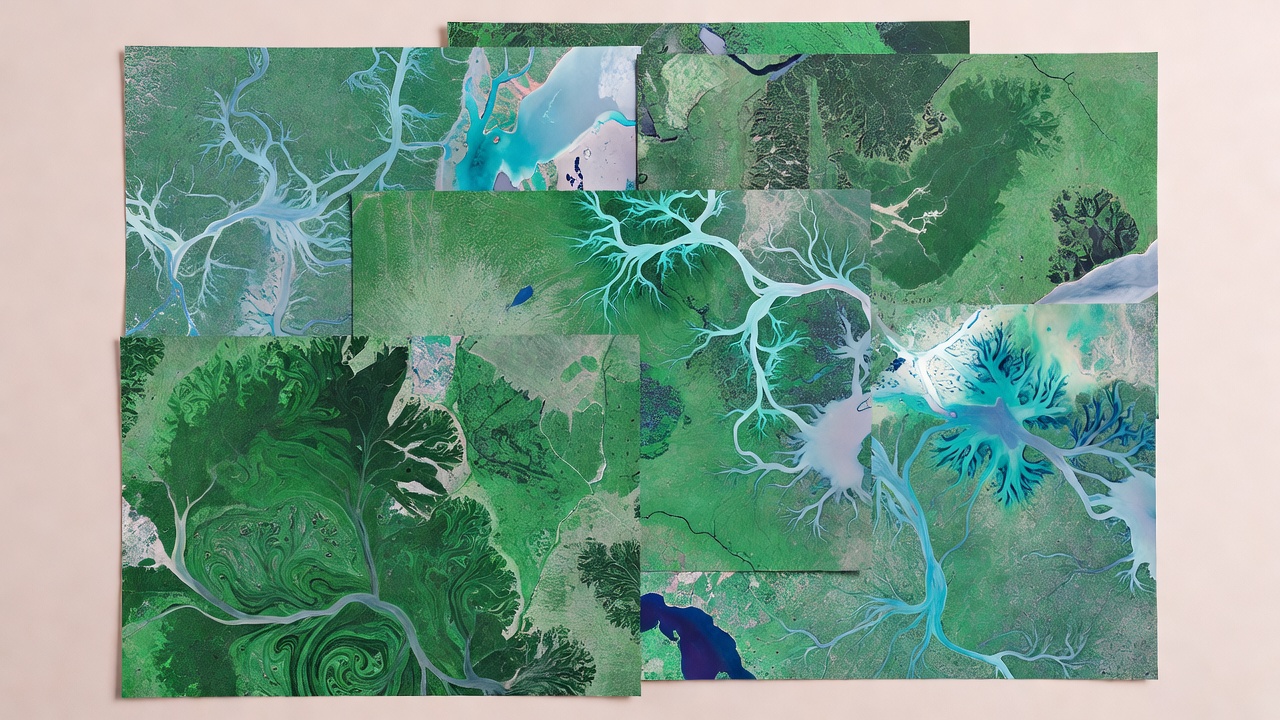
Remote imagery adds a landscape layer to movement research. Satellite and aerial sensors observe reflected or emitted energy across a defined area, then store it as measurements in pixels or image elements. Those measurements can be processed into useful descriptions of vegetation, surface water, snow cover, burned areas, coastal change or land use. Their value comes from coverage and repeat observation; their limits come from the sensor, the atmosphere, the processing choices and the date of acquisition.
Images are measurements, not windows
A satellite image is assembled from sensor readings. Different sensors record different parts of the electromagnetic spectrum and have different spatial, temporal and radiometric characteristics. Visible-light imagery may look familiar to a human viewer, while other bands can reveal patterns that are not apparent in a natural-colour rendering. A vegetation index, for example, is a calculation based on selected bands. It can serve as a useful indicator under suitable conditions, but it is not a direct photograph of ecological health.
Spatial resolution describes the ground area represented by a pixel. A coarser pixel summarizes a larger patch, which can be useful for broad regional comparisons but can obscure narrow features such as small wetlands or hedgerows. Fine-resolution imagery may show more detail, but its availability, cost, coverage and privacy implications may differ. Scale should follow the question: regional habitat trends and a small movement corridor do not require identical image products.
Temporal resolution concerns how often a place is observed. A sensor may pass over the same area regularly, yet clouds, smoke, darkness or acquisition schedules can prevent a usable view. A map assembled from the nearest available image is not necessarily a view from the day an animal passed through. The time difference should be stated and considered, especially when landscapes change quickly because of flooding, harvest, fire or seasonal growth.
From an image sheet to habitat classes
Researchers may classify pixels into broad categories such as forest, open water, grassland or built land. Classification can be performed with rules, statistical methods or machine-learning models trained on reference examples. The resulting map is an interpretation of measured signals, not the ground itself. A class boundary can be uncertain, and one label can contain several ecological conditions that matter differently to an animal.
Reference data help assess a classification. These may come from field observations, high-resolution imagery or other documented sources. Accuracy summaries can indicate how often mapped classes agree with reference labels, but a single overall score may hide differences among categories. Rare but important habitat types can be especially difficult to evaluate. A responsible analysis reports how the classification was checked, which classes were combined and where uncertainty remains.
Pre-processing matters. Images may need correction for atmospheric effects, geometric alignment, cloud masking or differences among sensors. If two dates are compared, their projections, resolutions, seasonal timing and processing should be compatible. Otherwise, apparent change can partly reflect a difference in the observation system rather than a true landscape change.
Pairing imagery with animal observations
When tracking locations are overlaid on imagery, the analyst must consider both data sources’ uncertainty. A location estimate may cover an area larger than a single pixel. The animal may have moved during the interval between fixes. The image may have been captured days or weeks from the movement observation. Treating a point as if it precisely samples a contemporaneous pixel can create false confidence.
One approach is to summarize habitat over an area that reflects location error or a study’s biological rationale, then test whether conclusions change under alternative scales. Another is to compare used locations with available habitat while accounting for sampling design. Either way, imagery is context for a question, not an automatic explanation. A pattern of locations near a particular land-cover class does not prove that the animal selected that feature or that the feature caused movement.
Remote sensing can be particularly helpful for regions where field access is difficult, for tracking broad seasonal change, and for identifying candidate areas for additional ground surveys. It can also make the unseen landscape between fixes more legible. But an image cannot repair a missing tag transmission, establish an animal’s motivation, or replace local ecological knowledge.
Responsible interpretation and sharing
Maps can communicate more certainty than their underlying inputs justify. Include acquisition dates, sensor or product information, processing steps, map scale and classification limits. If an image is used to describe habitat around a track, explain the temporal match and spatial method. Distinguish an observed measurement from a derived indicator and from an ecological interpretation.
Imagery can also expose sensitive places. A route combined with distinctive landscape features may reveal a nesting, denning or roosting area even if exact coordinates are omitted. Consider whether public maps need that level of detail. Generalization, masking or delayed publication may reduce risk while preserving the broad research finding. The appropriate choice depends on species, context and intended audience.
Questions to bring to an image
- What sensor and date produced this observation?
- What area does each pixel represent, and is it appropriate to the movement scale?
- Were clouds, shadows and other quality issues assessed?
- How were habitat labels created and validated?
- Could publishing the combined image and route disclose a sensitive location?
Imagery describes parts of the landscape; models connect observations across time. Continue to how uncertain journeys are reconstructed.